
Executive Summary
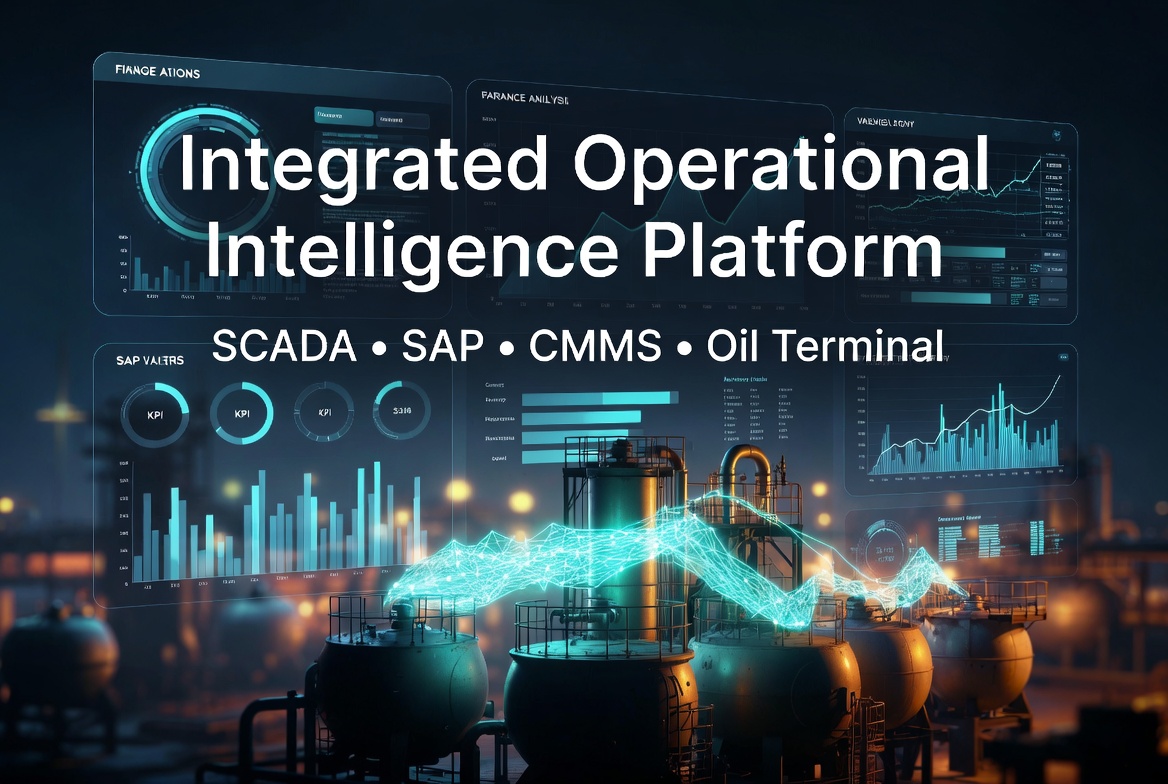
The objective of this project was to design and develop a real-time integrated Operational Intelligence Platform for an Oil Storage Terminal by consolidating live and periodic data from five mission-critical systems: SCADA/PI Historian, ATG Metering, CMMS/Maximo, HSE, and SAP ERP.
Prior to this initiative, operational, maintenance, safety, inventory, and financial data were fragmented across disparate systems, making it challenging for stakeholders to gain a unified, timely view of terminal performance.
The platform was built to deliver near real-time operational visibility, continuous monitoring of inventory movements, early identification of maintenance issues, proactive safety tracking, and ongoing financial performance evaluation against budget. By creating a single unified data layer with live SCADA feeds and synchronized periodic data, the solution enables management to make faster, more informed decisions based on a comprehensive, up-to-date view of terminal operations.
Key Outcomes: Operational performance remained stable with 100% pump uptime, inventory levels showed consistent growth, and safety corrective action closure reached 90%. However, the platform successfully highlighted a recurring monthly operating expenditure variance, flagging an annual budget overrun of USD 96,000 for immediate management attention.
Business Problem
Operational and business data were trapped in silos, with limited ability to correlate real-time process conditions (from SCADA) with financial outcomes (from SAP) or maintenance events (from CMMS). This resulted in delayed insights, reactive decision-making, and difficulty in identifying emerging cost or performance issues in a timely manner.
Solution
An advanced Operational Intelligence Platform was developed that integrates live SCADA data streams with structured data from ATG, CMMS, HSE, and SAP ERP systems. The solution provides a centralized dashboard with real-time operational metrics and near real-time business intelligence, empowering stakeholders with actionable insights for proactive terminal management and optimization.
2. Operations Performance Analysis (SCADA / PI Historian)
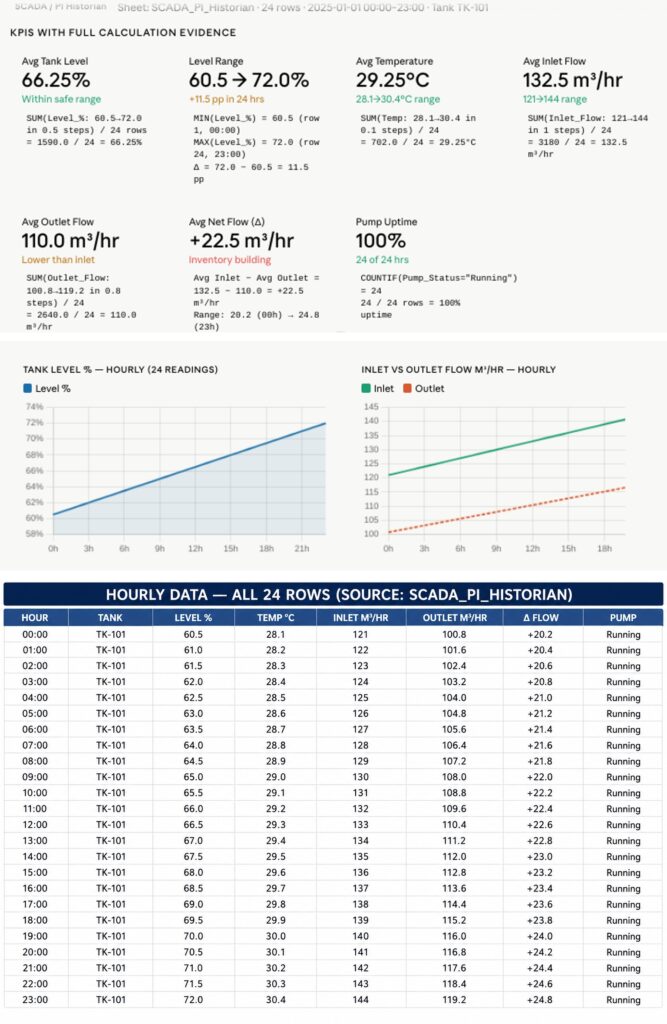
The operations module of the dashboard visualizes live process data including tank levels, flow rates, temperatures, and pump operating status directly from the SCADA/PI Historian system. These real-time indicators give operational personnel immediate visibility into terminal health and process stability.
Analysis Highlights:
- Tank levels and temperatures remained stable throughout the monitoring period with no critical deviations.
- Flow analysis revealed a consistent positive net flow differential of 22.5 m³/hr, indicating steady inbound product movement.
- Pump availability maintained 100% uptime based on continuous status monitoring.
Business Insight The integration of live SCADA data provides operations teams with true real-time visibility, enabling early detection of anomalies and supporting rapid response to maintain optimal terminal performance.
Business Impact By replacing manual checks across multiple interfaces with a single real-time dashboard, the platform significantly improves operational responsiveness, reduces downtime risk, and supports data-driven production planning.
3. Inventory and Product Quality Analysis (ATG Metering)
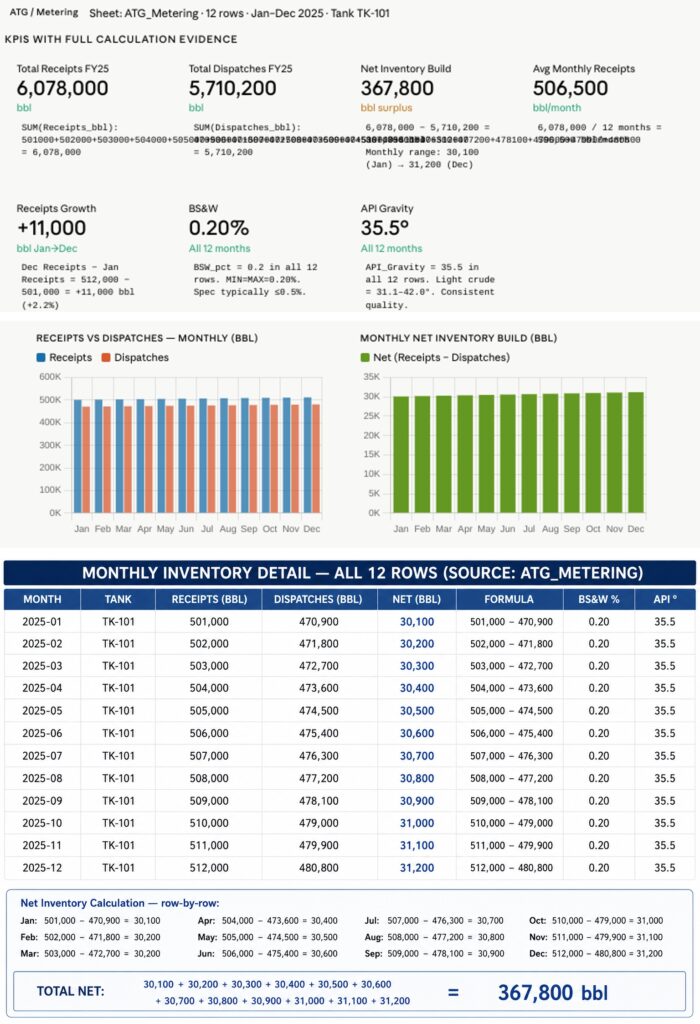
The inventory dashboard tracks monthly receipts, dispatches, inventory build-up, and product quality indicators. These visualisations provide visibility into storage utilisation and product movement throughout the year.
Analysis showed that annual receipts exceeded dispatch volumes, resulting in a net inventory increase of approximately 367,800 barrels. Product quality indicators remained within acceptable operational ranges, indicating stable handling and storage conditions.
Business Insight
The terminal demonstrated consistent inventory growth during the reporting period. This suggests strong product availability and effective throughput management. Inventory accumulation also provides management with visibility into future storage requirements and utilisation planning.
Business Impact
Inventory visibility supports more accurate operational planning, storage allocation decisions, and forecasting activities. Management can use these insights to optimise tank utilisation and minimise inventory-related operational constraints.
4. Maintenance Performance Overview (CMMS / Maximo)
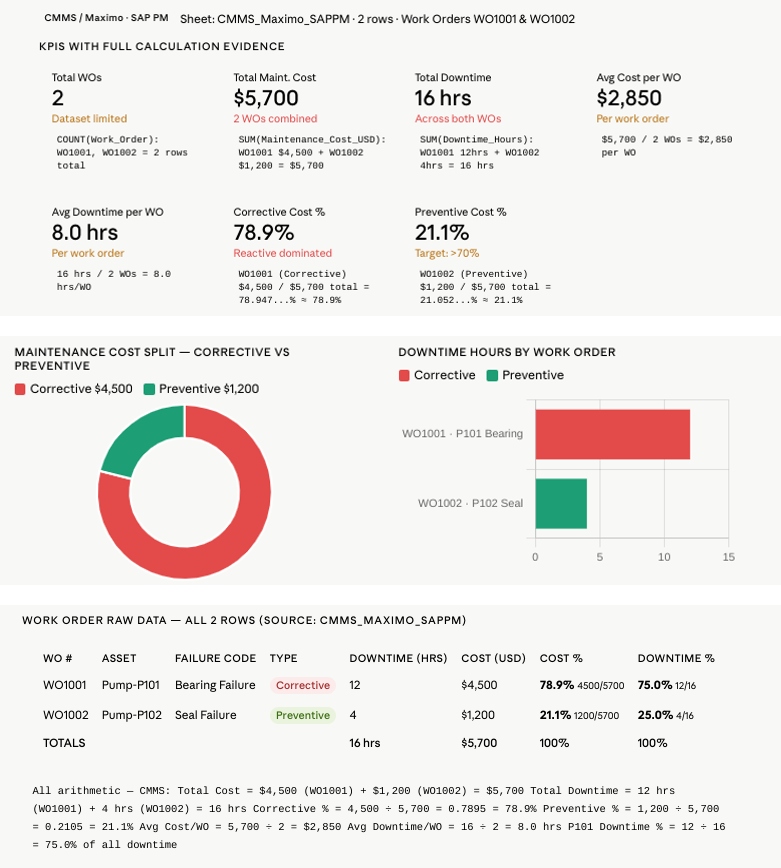
The maintenance dashboard provides a snapshot of work order activity, maintenance costs, downtime hours, and observed failure modes. Although the available dataset was limited, it provided useful insights into maintenance expenditure and downtime contributors.
Analysis identified Pump P-101 as the largest contributor to maintenance cost and downtime. A bearing-related failure generated USD 4,500 in maintenance expenditure and 12 hours of downtime, accounting for approximately 78.9% of recorded maintenance costs.
Business Insight
The analysis indicates that corrective maintenance activities are significantly more expensive than preventive interventions. The concentration of cost within a single failure event highlights the financial impact of unplanned equipment breakdowns.
Business Impact
Although the data represents a maintenance snapshot rather than a full reliability assessment, it demonstrates the value of monitoring failure events and maintenance costs. Early identification of recurring failure modes can support improved maintenance planning, reduce downtime, and minimise unexpected repair costs.
5. Health, Safety and Environment Performance (HSE)
The HSE dashboard tracks incidents, near misses, corrective actions, and closure performance. These metrics provide visibility into safety compliance and corrective action effectiveness.
The analysis showed a corrective action closure rate of 90%, indicating that most identified issues were successfully addressed within the reporting period.
Business Insight
The high closure rate demonstrates a proactive approach to safety management and corrective action implementation. Effective closure of safety actions helps reduce operational risk and strengthens compliance performance.
Business Impact
Providing management with visibility into safety performance supports continuous improvement initiatives and regulatory compliance. The dashboard enables stakeholders to monitor corrective action effectiveness and prioritise unresolved issues.
6. Financial Performance Analysis (SAP ERP)
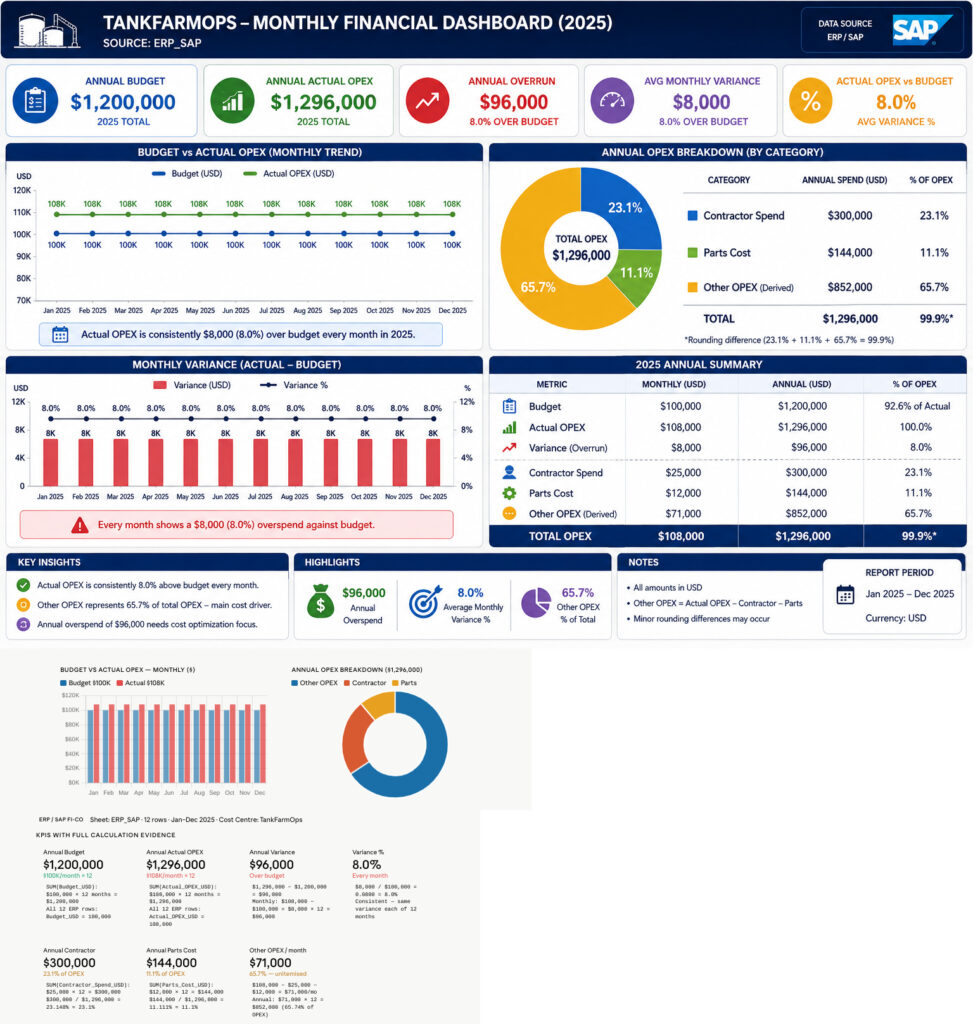
The financial module delivers near real-time visibility into budgeted versus actual operating expenditure by integrating SAP ERP data with operational context from SCADA and maintenance systems.
The analysis identified a consistent monthly budget variance of USD 8,000, resulting in an annual overspend of USD 96,000. Cost composition analysis showed that “Other OPEX” accounted for 65.7% of total expenditure — the primary cost driver.
Business Insight The platform successfully transforms periodic SAP data into actionable near real-time intelligence by correlating financial performance with live operational activity, enabling faster identification and response to budget overruns.
Business Impact Management can now monitor spending trends more proactively, investigate cost drivers earlier in the month, and implement corrective actions before small variances escalate into significant overruns.
7. Data Governance and Methodology
To ensure the reliability of business insights, a structured data quality framework was implemented before analysis. Validation activities included checks for missing values, duplicate records, data type consistency, operational ranges, and timestamp continuity.
All datasets passed core quality checks, with no missing values or duplicate records identified. However, the maintenance dataset contained only two work orders and therefore supports descriptive analysis rather than long-term reliability assessment. Similarly, HSE and ERP datasets displayed uniform monthly values and should be validated against source systems for future reporting cycles.
The analytical workflow consisted of data extraction, cleansing, validation, KPI development, and dashboard visualisation using Python, Pandas, NumPy, OpenPyXL, and a Power BI-style reporting interface.
Business Recommendations
Based on the analysis, several actions are recommended to improve operational efficiency and business performance.
1. Strengthen Cost Management Controls
The annual operating expenditure exceeded budget by USD 96,000. Management should perform a detailed review of Other OPEX categories to identify cost drivers and implement targeted cost reduction initiatives.
2. Expand Maintenance Data Collection
Future dashboard versions should integrate additional CMMS work order history to enable deeper maintenance analysis. This would support asset criticality assessment, downtime trend monitoring, and reliability KPI development.
3. Shift Towards Preventive Maintenance
The observed maintenance data suggests that corrective maintenance events carry significantly higher financial consequences. Increasing preventive maintenance activities may reduce future downtime and maintenance expenditure.
4. Maintain Operational Monitoring Practices
The stable operational performance observed within the SCADA data demonstrates the value of continuous monitoring. Management should continue leveraging real-time operational dashboards to support proactive decision-making.
5. Improve Data Governance
Uniform values observed within HSE and ERP datasets should be periodically validated against source systems to ensure reporting accuracy and maintain stakeholder confidence in dashboard outputs.
Conclusion
This project successfully demonstrated how operational, maintenance, inventory, safety, and financial data can be integrated into a single business intelligence solution for oil terminal operations.
The dashboard provided stakeholders with a unified view of terminal performance, replacing fragmented reporting processes with a centralised decision-support platform. Analysis revealed strong operational stability, positive inventory growth, high corrective action closure rates, and opportunities for financial improvement through enhanced cost management.
While maintenance analysis was limited by the availability of work order data, the project successfully highlighted the importance of integrated reporting and data-driven decision-making within terminal operations. The resulting solution provides a scalable foundation for future enhancements, including advanced reliability analytics, predictive maintenance capabilities, and enterprise-wide performance monitoring.
Overall, the project demonstrates the practical application of data analytics, business intelligence, and operational performance management to solve a real-world industrial business problem and deliver actionable insights for decision-makers.
Egho Bright