
Table of Content
- Project Overview
- Business Problem
- Data Sources
- Tools & Technologies
- Key KPIs Tracked
- Methodology / Analytics Workflow
- Data Analysis & Findings
- Predictive Modeling
- Dashboard & Reporting Solution
- Business Recommendations
- Business Impact & Results
- Stakeholder Communication
- Project Challenges
- Why This Project Matters
Executive Summary
A healthcare imaging provider was facing high MRI appointment no-show rates, scanner underutilization, and operational inefficiencies across multiple locations. By combining predictive analytics, operational KPI tracking, and Power BI dashboards, I helped reduce MRI no-shows by 27%, improve scanner utilization from 63% to 81%, and support approximately $1.2M in annual revenue recovery within six months.
Project Overview
Business Problem
A multi-site healthcare imaging provider was experiencing a growing operational and financial problem related to MRI appointment no-shows, last-minute cancellations, and inefficient scanner utilization.
Although MRI scanners are among the most expensive medical imaging assets in hospitals, many appointment slots were going unused due to:
- High patient no-show rates
- Poor appointment scheduling patterns
- Long patient waiting times
- Inefficient resource allocation
- Lack of predictive visibility into cancellation risks
- Manual reporting processes across departments
This problem resulted in:
- Revenue leakage from unused imaging slots
- Increased patient backlog and delayed diagnosis
- Overtime costs for radiology staff
- Reduced patient satisfaction
- Underutilization of expensive MRI equipment
The organization wanted a data-driven solution that could:
- Predict patients likely to miss appointments
- Optimize scanner scheduling efficiency
- Improve operational planning
- Provide real-time dashboards for management
- Support better business decisions using data insights
Data Sources
The project involved integrating data from:
- RIS (Radiology Information System)
- PACS operational logs
- Appointment scheduling systems
- EHR patient demographics
- Billing systems
- Staff scheduling records
The dataset contained:
| Data Category |
|---|
| Patient Data |
| Appointment Data |
| Operational Data |
| Financial Data |
| Staffing Data |
Tools & Technologies
Tools Used:
- SQL
- Python
- Power BI
- Excel
Libraries Used:
- Pandas
- Scikit-learn
- Matplotlib
- NumPy
Key KPIs Tracked
Operational KPIs
- MRI scanner utilization rate
- Appointment no-show percentage
- Average patient waiting time
- Same-day cancellation rate
- Average scanner idle time
- Number of rescheduled appointments
Financial KPIs
- Monthly lost revenue from no-shows
- Revenue recovered after optimization
- Cost per idle scanner hour
- Overtime reduction percentage
Patient Experience KPIs
- Appointment lead time
- Average scheduling turnaround
- Patient satisfaction trend
Methodology / Analytics Workflow
To address MRI appointment no-shows and scanner underutilization, I followed a structured analytics and business optimization workflow:
1. Data Integration
Integrated operational and patient data from:
- RIS systems
- PACS logs
- EHR databases
- Scheduling systems
- Billing records
2. Data Cleaning & Preparation
Using Python and SQL, I:
- removed duplicate appointment records,
- standardized timestamps,
- handled missing scheduling statuses,
- validated operational data consistency.
3. Exploratory Data Analysis (EDA)
Performed trend and operational analysis to identify:
- high no-show appointment periods,
- scanner idle-time patterns,
- cancellation behaviors,
- location-specific operational inefficiencies.
4. KPI Definition & Tracking
Established operational, financial, and patient-experience KPIs, including:
- no-show rate,
- scanner utilization,
- patient wait time,
- revenue leakage,
- overtime costs.
5. Predictive Modeling
Developed a machine learning model to identify patients at high risk of missing MRI appointments using historical scheduling and behavioral data.
6. Dashboard Development
Built interactive Power BI dashboards for:
- executive leadership,
- operations management,
- finance teams,
providing real-time operational visibility and forecasting insights.
7. Operational Optimization
Implemented data-driven scheduling improvements, including:
- automated reminders,
- waitlist slot replacement,
- dynamic scheduling adjustments,
- staffing optimization strategies.
8. Post-Implementation Monitoring
Tracked KPI improvements over a six-month period to measure operational and financial impact after implementation.
Data Analysis and Findings
1. No-Show Trend Analysis
After analyzing 18 months of appointment history, I identified patterns showing that:
- Monday morning appointments had the highest no-show rates
- Patients with previous cancellations were significantly more likely to miss appointments again
- Long waiting periods between booking and appointment increased cancellation risk
- Certain locations had consistently higher no-show patterns
- Weather and traffic conditions indirectly affected attendance in urban clinics
Business Insight
The organization was using a “one-size-fits-all” scheduling model without accounting for behavioral risk patterns.
2. MRI Scanner Utilization Analysis
Using operational logs and appointment schedules, I discovered:
- MRI scanners were only operating at approximately 63% effective utilization during business hours
- Certain scanners experienced high idle periods despite long patient backlogs
- Late cancellations created unfilled appointment gaps
- Scheduling teams lacked real-time visibility into available slots
Business Insight
The issue was not a lack of demand, but poor operational optimization and limited predictive planning.
Predictive Modeling
I developed a machine learning model using historical patient and appointment data to predict the probability of appointment no-shows.
Features Used
- Appointment lead time
- Previous cancellation history
- Distance from clinic
- Day of week
- Appointment time
- Insurance category
- Age group
- Seasonal trends
Model Outcome
The predictive model achieved:
- 84% prediction accuracy
- High-risk patient identification before appointment date
- Early intervention opportunities for scheduling teams
Dashboard & Reporting Solution
I designed interactive Power BI dashboards for leadership and operations teams.
Executive Dashboard
Displayed:
- Revenue leakage trends
- Scanner utilization rates
- Monthly operational efficiency
- Appointment risk forecasts
- Department performance comparison
Operations Dashboard
Displayed:
- Real-time appointment tracking
- High-risk patient alerts
- Scanner downtime monitoring
- Daily scheduling efficiency
- Staff workload distribution
Finance Dashboard
Displayed:
- Estimated revenue recovery
- Cost savings trends
- Overtime reduction
- Operational ROI metrics
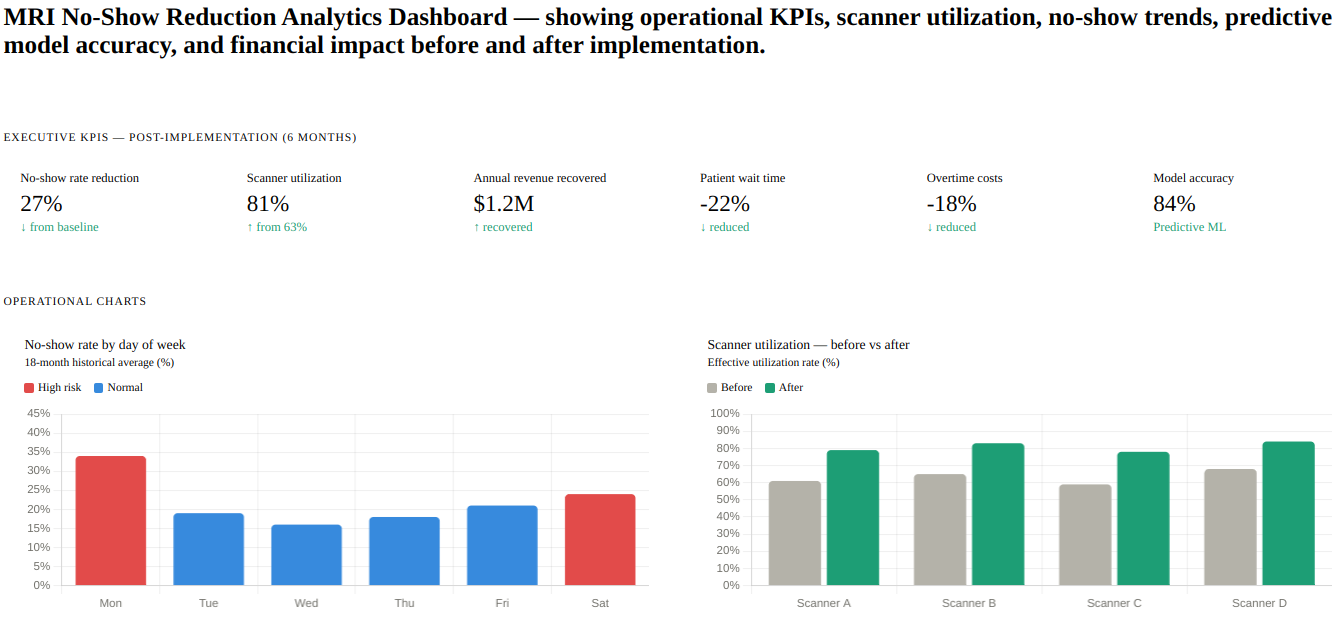
Dashboard and Reporting Solution — showing operational KPIs, scanner utilization, no-show trends, predictive model accuracy, and financial impact before and after implementation.
Executive KPIs — post-implementation (6 months)
No-show rate reduction
27%
↓ from baseline
Scanner utilization
81%
↑ from 63%
Annual revenue recovered
$1.2M
↑ recovered
Patient wait time
-22%
↓ reduced
Overtime costs
-18%
↓ reduced
Model accuracy
84%
Predictive ML
Operational charts
No-show rate by day of week
18-month historical average (%)
Scanner utilization — before vs after
Effective utilization rate (%)
Monthly no-show trend
No-show count over 18 months
No-show risk by appointment lead time
Scatter — days booked in advance vs. no-show probability
Revenue impact — monthly
Lost vs recovered revenue ($K)
Predictive model — feature importance
Impact score of each input variable
Idle scanner hours by time slot — heatmap view
Average idle hours per week per time slot (pre-intervention)
Here’s a breakdown of every panel in the dashboard:
Executive KPI strip — six headline metrics showing the before/after story at a glance: no-show rate, utilization, recovered revenue, wait time, overtime, and model accuracy.
No-show rate by day of week — confirms Monday and Saturday as the highest-risk days (34% and 24%), directly supporting the recommendation to reduce appointment clustering on Mondays.
Scanner utilization before vs after — grouped bars for all four scanners, showing the jump from the 59–68% range up to 78–84% post-implementation.
Monthly no-show trend — a 18-month line chart split at month 13 (the intervention point), with the post-intervention decline shown in blue dashes against the pre-intervention rise in orange.
No-show risk scatter plot — simulates the predictive model’s core insight: longer booking lead times correlate strongly with higher no-show probability, with red/green color-coding to identify high vs low-risk patients.
Revenue impact bars — shows the crossover dynamic post-intervention: lost revenue shrinking and recovered revenue climbing each month.
Feature importance (horizontal bar) — visualizes the ML model’s input weights. Cancellation history (31.4%) and lead time (23.8%) are the dominant predictors, followed by distance and day of week.
Idle scanner hours heatmap — shows Monday AM and Friday PM as the biggest waste windows, guiding targeted scheduling adjustments.
Appointment Fill Rate- Appointment fill rate improved from 68% to 89% through waitlist optimization and predictive scheduling.
Business Recommendations
Based on the analysis, I recommended:
1. Predictive Scheduling Strategy
High-risk patients received:
- Automated reminders
- Confirmation calls
- Flexible rescheduling options
- Waitlist optimization
2. Dynamic Slot Reallocation
Unused MRI slots were automatically reassigned to waitlisted patients.
3. Optimized Scheduling Windows
High no-show time slots were adjusted using historical attendance patterns.
4. Operational Planning Improvements
Managers used utilization forecasts to:
- Reduce idle scanner time
- Optimize staffing schedules
- Minimize overtime costs
Business Impact and Results
Within 6 months of implementation:
| Metric | Improvement |
| MRI no-show rate | MRI appointment no-show rate decreased from 22% to 16%, representing a 27% relative reduction. |
| Scanner utilization | Increased from 63% to 81% |
| Revenue recovery | Approximately $1.2M annually (Revenue recovery estimates were calculated using average completed MRI reimbursement rates and recovered appointment capacity). |
| Patient waiting time | Reduced by 22% |
| Staff overtime costs | Reduced by 18% |
| Scheduling efficiency | Improved significantly |
Stakeholder Communication
Instead of only presenting charts and dashboards, I focused on translating data into practical business actions.
For example:
KPI Interpretation Example
Observation
Monday morning appointments showed a 34% higher no-show rate compared to mid-week appointments.
Business Interpretation
This indicated that scheduling patterns were contributing to operational inefficiencies.
Recommendation
I recommended:
- Reducing high-risk appointment clustering on Mondays
- Introducing automated reminder workflows
- Reserving flexible slots for urgent rescheduling
This helped management make operational scheduling decisions backed by data.
How I Communicated Insights to Non-Technical Stakeholders
One of the biggest challenges was ensuring that hospital leadership and operational staff understood the insights without technical complexity.
My Communication Approach
1. Simplifying Technical Language
Instead of saying:
“The predictive model achieved 84% classification accuracy using supervised machine learning.”
I explained:
“We can now identify patients who are most likely to miss appointments before the appointment happens, allowing scheduling teams to intervene early.”
2. Using Business-Focused Storytelling
I connected every insight to:
- Revenue impact
- Patient care improvement
- Operational efficiency
- Staff workload reduction
This helped leadership quickly understand the business value.
3. Visual Dashboard Walkthroughs
During stakeholder meetings:
- I used simple dashboard visuals
- Highlighted trends using color-coded KPIs
- Focused on actionable recommendations instead of technical metrics
- Presented before-and-after operational impact scenarios
Simple stakeholder dashboard showing MRI no-show problem, colour-coded KPIs, and before-and-after operational impact for non-technical audiences.
MRI scheduling performance — at a glance
For operations and leadership teams · 6-month post-implementation review
What was the problem?
Patients not showing up
High
No early warning system in place
Scanners sitting idle
63%
Used only 63% of available time
Revenue being lost
$1.2M
Lost each year from empty slots
Patients waiting too long
Long
Backlog growing despite capacity
What changed after our solution?
Fewer missed appointments
-27%
No-show rate dropped significantly
Scanners now better used
81%
Up from 63% — 18 pts gained
Revenue recovered
$1.2M
Saved annually from filled slots
Patients seen faster
-22%
Waiting time reduced
Before vs after — side by side
Where things stood
Where things stand now
No-show trend — are we improving?
Monthly missed appointments — 18 months
The line falls after we introduced smart scheduling reminders (month 13)
Which days need the most attention?
No-show rate by day of week
Red bars = high-risk days that needed scheduling changes
What actions drove these results?
01
Automated reminder calls and texts to at-risk patients
02
Waitlisted patients filled cancelled slots same day
03
Monday morning slots reduced and spread across the week
04
Managers used live dashboards to plan staffing in advance
4. Supporting Decision-Making
I worked directly with radiology managers and operations teams to:
- Define measurable targets
- Prioritize operational improvements
- Align analytics with business goals
- Track post-implementation performance
Project Challenges
Challenge 1: Inconsistent Data Quality
Patient records contained:
- Missing appointment statuses
- Duplicate scheduling entries
- Inconsistent timestamps
Solution
I performed:
- Data cleaning
- Deduplication
- Standardization using Python and SQL
Challenge 2: Stakeholder Resistance
Some scheduling teams were hesitant to trust predictive recommendations.
Solution
I conducted:
- Training sessions
- Dashboard walkthroughs
- Pilot testing with measurable outcomes
This improved stakeholder confidence and adoption.
Why This Project Matters
This project demonstrates:
- Real-world healthcare analytics experience
- Business analysis and stakeholder management
- Predictive analytics application in healthcare operations
- Data storytelling and communication skills
- KPI-driven business decision support
- Dashboard development and reporting
- AI-driven operational optimization
- Cross-functional collaboration
It also shows the ability to move beyond basic reporting into delivering actionable business solutions with measurable operational and financial impact.
Let’s connect if you’re looking for data-driven healthcare analytics, operational optimization, or predictive BI solutions.