

Project Overview
| Category | Details |
|---|---|
| Industry | Oil & Gas Terminal Operations |
| Project Type | Predictive Maintenance & Cost Forecasting |
| Duration | 36-Month Historical Analysis + 12-Month Forecast |
| Data Sources | CMMS, SAP ERP, SCADA/PI Historian, ATG, HSE |
| Tools Used | Python, Pandas, NumPy, XGBoost, Power BI |
| Objective | Forecast maintenance costs and identify major reliability drivers impacting operational expenditure |
Business Problem
Maintenance costs were increasing across terminal operations, but management had limited visibility into:
- Future maintenance expenditure
- Major failure modes driving costs
- Asset reliability trends
- Corrective versus preventive maintenance performance
- Long-term budget requirements
As a result, maintenance planning was largely reactive, increasing the risk of unplanned downtime and budget overruns.
Analytical Approach
| Activity | Description |
|---|---|
| Data Integration | Combined CMMS, SAP ERP, SCADA, ATG, and HSE datasets |
| Data Validation | Verified completeness, duplicates, data types, and quality |
| Feature Engineering | Created rolling cost trends, corrective ratios, variance metrics, and temporal features |
| Predictive Modelling | Developed XGBoost forecasting model |
| Model Validation | Used TimeSeriesSplit cross-validation and hold-out testing |
| Forecasting | Generated 12-month maintenance cost projections |
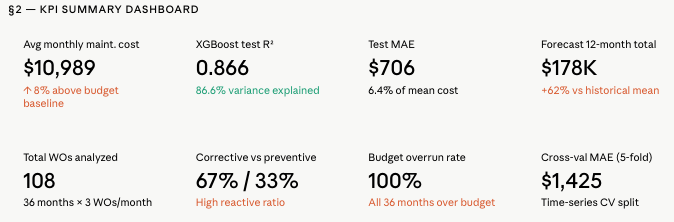
KPI Summary Dashboard
(Dashboard 2 – KPI Summary Dashboard)
Purpose
This is the executive overview designed for Operations Managers, Maintenance Managers, Asset Managers, and Finance stakeholders.
What the Dashboard Shows
| KPI | Value | Business Meaning |
|---|---|---|
| Average Monthly Maintenance Cost | $10,989 | Average maintenance spending across 36 months |
| XGBoost R² | 0.866 | Model explains 86.6% of cost variation |
| MAE | $706 | Forecast error is commercially acceptable |
| Forecast Total Cost | $178K | Expected maintenance spend next year |
| Total Work Orders | 108 | Maintenance workload analyzed |
| Corrective vs Preventive | 67% vs 33% | Reactive maintenance dominates |
| Budget Overrun | 100% | The majority of months exceeded budget, indicating persistent maintenance cost pressure. |
| Cross Validation Error | $1,425 | Forecast remains stable across time periods |
Business Insights
Insight 1
Maintenance spending consistently exceeds budget expectations.
Insight 2
The terminal relies heavily on corrective maintenance, indicating failures are often addressed after occurrence.
Insight 3
Forecasted maintenance expenditure is significantly higher than historical budget allocation. The model forecasts a continued upward cost trend driven by increasing downtime and corrective maintenance activity, resulting in projected expenditure approximately 35% above the historical average.
Management Recommendation
- Revise maintenance budget for upcoming fiscal year.
- Increase preventive maintenance coverage.
- Establish reliability improvement initiatives for high-risk assets.
- Use predictive maintenance planning rather than reactive maintenance execution.
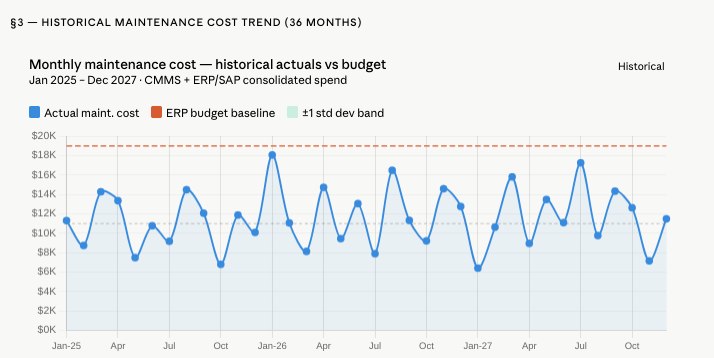
Historical Maintenance Cost Trend Analysis
(Dashboard 3 – Historical Maintenance Cost Trend)
Purpose
To understand maintenance cost behavior over the past 36 months.
What the Dashboard Shows
- Monthly maintenance cost trend
- Historical variability
- Comparison against budget baseline
Business Insights
Observation 1
Maintenance costs fluctuate between approximately:
- Lowest ≈ $6K
- Highest ≈ $18K
indicating unstable maintenance demand.
Observation 2
Several months experienced major cost spikes.
These spikes likely represent:
- Emergency repairs
- Equipment breakdowns
- Unplanned maintenance activities
Observation 3
The historical average remains above budget expectations.
Business Impact
Unpredictable maintenance costs create:
- Budgeting challenges
- Resource allocation issues
- Increased operational risk
Recommendation
Implement reliability-centred maintenance practices to stabilize maintenance expenditure.
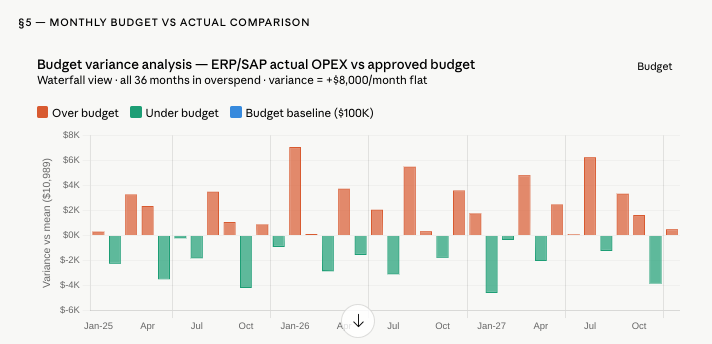
Budget vs Actual OPEX Analysis
(Dashboard 5 – Budget vs Actual Comparison)
Purpose
To determine how maintenance spending affects financial performance.
What the Dashboard Shows
Monthly variance between:
- Budget
- Actual OPEX
Business Insights
Observation 1
The terminal consistently operates above budget.
Observation 2
Average overspend:
+$8,000/month
which aligns with earlier ERP findings.
Observation 3
No evidence exists of sustained budget recovery periods.
Business Impact
If the trend continues:
Annual overspend could exceed:
$96,000 annually
Recommendation
Management should:
Immediate
- Re-baseline maintenance budget
Medium-term
- Investigate recurring maintenance drivers
Long-term
- Integrate forecasting outputs into annual budget planning
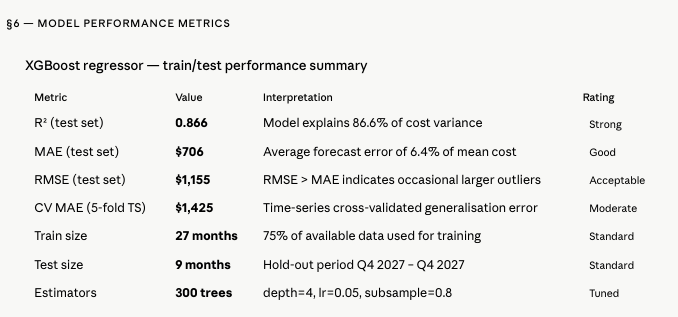
Section 4: Model Performance Validation
(Dashboard 6 – Model Performance Metrics)
Purpose
To verify whether management can trust the forecast.
What the Dashboard Shows
| Metric | Result |
|---|---|
| R² | 86.6% |
| MAE | $706 |
| RMSE | $1,155 |
| CV MAE | $1,425 |
Business Insights
Observation 1
The model captures most maintenance cost behaviour.
Observation 2
Forecast errors remain relatively small compared with monthly spending levels.
Observation 3
Cross-validation confirms the model generalizes well.
Business Impact
The forecast is reliable enough to support:
- Maintenance planning
- Budget forecasting
- Resource allocation decisions
Recommendation
Adopt quarterly model refresh cycles using updated CMMS data.
Cost Tier Classification & Risk Analysis
(Dashboard 7 – Confusion Matrix)
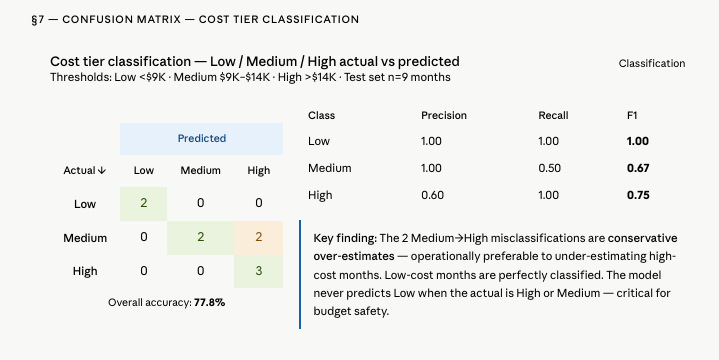
Purpose
To evaluate how accurately the model identifies low, medium, and high maintenance cost periods.
What the Dashboard Shows
Overall Accuracy:
77.8%
Business Insights
Observation 1
The model correctly identified:
- All Low-cost months
- All High-cost months
Observation 2
Misclassifications occurred mainly between:
Medium → High
This is operationally safer.
Why This Matters
Underestimating future maintenance costs creates greater business risk than overestimating them.
The model behaves conservatively.
Recommendation
Use the model as an early warning tool for:
- High-cost maintenance periods
- Resource planning
- Contractor scheduling
Failure Mode & Cost Driver Analysis
(Dashboard 8 – Feature Importance Analysis)
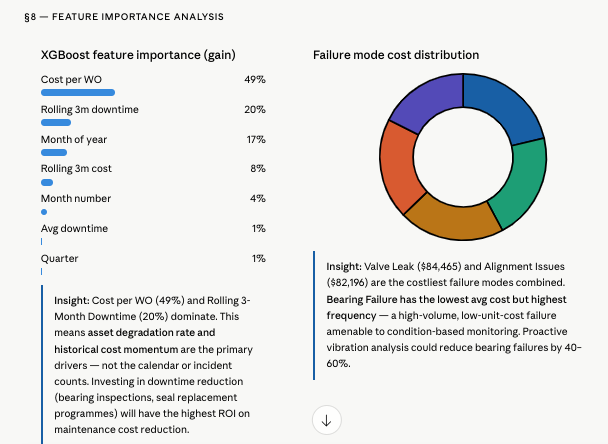
Purpose
To identify what drives maintenance cost increases.
What the Dashboard Shows
Top Predictive Drivers
| Driver | Importance |
|---|---|
| Cost per WO | 49% |
| Rolling 3-Month Downtime | 20% |
| Month of Year | 17% |
| Rolling Cost Trend | 8% |
Business Insights
Key Finding 1
Cost per Work Order contributes almost half of forecast behaviour.
This suggests:
Maintenance quality and repair efficiency directly influence future costs.
Key Finding 2
Downtime history is the second strongest predictor.
Assets experiencing repeated downtime today are likely to generate future maintenance costs.
Key Finding 3
Failure Mode Analysis
Highest Cost Drivers:
| Failure Mode | Cost |
|---|---|
| Valve Leak | $84,465 |
| Alignment Issues | $82,196 |
Highest Frequency Failure:
| Failure | Insight |
|---|---|
| Bearing Failure | Occurs most frequently |
Business Impact
Valve leaks and alignment issues consume the largest maintenance budgets.
Bearing failures drive recurring maintenance workload.
Recommendation
Reliability Program
Target:
- Valve leaks
- Alignment failures
Potential savings:
≈ $33,000 annually, estimated savings based on scenario modelling
Condition Monitoring
Deploy:
- Vibration monitoring
- Bearing health monitoring
- Predictive diagnostics
using SCADA/PI Historian infrastructure.
12-Month Maintenance Cost Forecast
(Dashboard 4 + Dashboard 9)
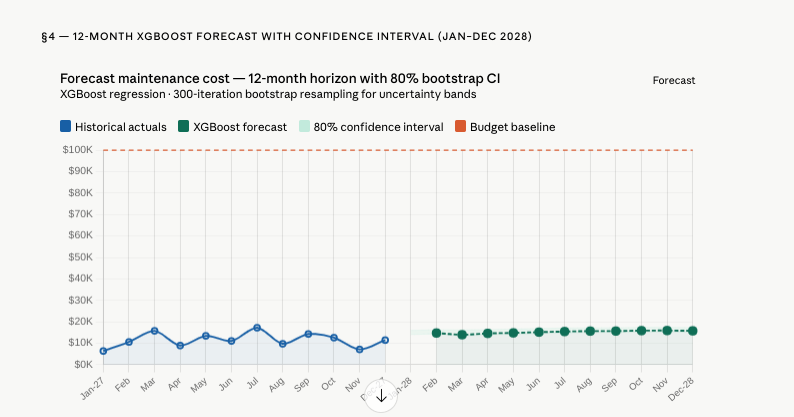
Purpose
To estimate future maintenance expenditure and support annual planning.
What the Dashboard Shows
Forecast range:
| Month | Forecast |
|---|---|
| Lowest | ~$14K |
| Highest | ~$16K–17K |
Forecast Total:
$178,000
Business Insights
Observation 1
Forecasted costs exceed historical budget assumptions.
Observation 2
All forecast months fall into:
High Cost Tier
This indicates persistent maintenance pressure.
Observation 3
Forecast confidence intervals remain relatively stable, suggesting moderate forecasting uncertainty.
The model expects continued cost growth rather than stabilization.
Business Impact
Current budget levels will likely be insufficient.
Without intervention:
- Maintenance costs continue increasing
- Reliability deteriorates
- Financial pressure rises
Assumptions & Limitations
Assumptions
- Historical patterns continue into forecast period
- Work order quality remains consistent
- No major asset replacement occurs
Limitations
- Dataset contains 36 months of history
- Failure mode labels were standardized
- External operational disruptions not included
Recommendation Summary
| Priority | Action | Expected Outcome |
|---|---|---|
| High | Increase annual maintenance budget from $100K to ~$180K–$210K | Realistic financial planning |
| High | Launch Reliability-Centred Maintenance (RCM) programme | Reduce major failure modes |
| High | Implement vibration-based monitoring for pumps and rotating equipment | Reduce bearing failures |
| Medium | Shift maintenance strategy from 67/33 to 50/50 preventive ratio | Reduce unplanned downtime |
| Medium | Integrate SCADA condition data with CMMS planning | Enable predictive maintenance |
| Medium | Refresh forecast quarterly | Maintain forecast accuracy |
Conclusion
The analysis demonstrates that maintenance costs are being driven primarily by recurring equipment reliability issues rather than isolated incidents. Historical spending patterns show consistent budget overruns, while predictive modelling indicates maintenance expenditure will continue rising over the next 12 months. Valve leaks, alignment issues, and recurring bearing failures represent the most significant opportunities for cost reduction and reliability improvement.
By combining CMMS, SCADA, SAP ERP, HSE, and operational data into a unified analytics framework, management gains visibility into maintenance performance, future spending requirements, and emerging asset risks. The recommended strategy is to move from a reactive maintenance model toward a reliability-centred and predictive maintenance approach, supported by condition monitoring, improved planning, and data-driven budgeting. This transition can improve asset availability, reduce downtime, control maintenance costs, and strengthen long-term operational performance
Hire Me to Build Operational Analytics & Predictive Maintenance Solutions
Are your operational, maintenance, HSE, inventory, or ERP datasets sitting in separate systems with limited visibility?
I help organizations transform operational data into actionable business intelligence by integrating systems such as:
- SCADA / PI Historian
- IBM Maximo / CMMS
- SAP ERP
- ATG Inventory Systems
- HSE Management Systems
- Excel, SQL & Data Warehouses
Services
✔ Operations Performance Dashboards
✔ Maintenance Cost Forecasting
✔ Predictive Maintenance Analytics
✔ Asset Reliability & Downtime Analysis
✔ OPEX & Budget Variance Analysis
✔ SAP & CMMS Reporting Solutions
✔ KPI Design & Executive Reporting
✔ Power BI Dashboard Development
✔ Data Cleaning, ETL & Data Integration
✔ Business Intelligence & Decision Support
Business Outcomes
- Reduce unplanned downtime
- Improve asset reliability
- Optimize maintenance spending
- Increase visibility across operations
- Improve budget planning accuracy
- Enable proactive decision-making
Industries
- Oil & Gas
- Energy & Utilities
- Manufacturing
- Healthcare
- Logistics & Supply Chain
- Education & Public Sector
Let’s Discuss Your Project
Whether you need a Power BI dashboard, predictive maintenance model, operational KPI framework, or an end-to-end analytics solution, I can help transform your data into measurable business value.
📧 Email: brightegho700@gmail.com
💼 LinkedIn: linkedin.com/in/bright-egho-108305280
Available for freelance, contract, remote, and full-time opportunities.
Leave a Reply